You launched your LLM-powered feature. Requests are flowing. Costs are climbing. But you don't know which model is slowest, which provider is throwing errors, or whether your cache is actually working. This is the observability gap — and closing it starts at the gateway.
DeltaLLM exposes Prometheus metrics, health endpoints, and callback integrations so you can monitor every request, track provider behavior, and alert on problems before users notice.
Health Endpoints
Before anything else, set up health checks. DeltaLLM exposes five endpoints that tell you exactly what's working:
| Endpoint | What it checks |
|---|---|
/health | Combined liveliness and readiness — is everything OK? |
/health/liveliness | Is the process running? |
/health/readiness | Can the gateway reach Redis and PostgreSQL? |
/health/deployments | Health summary of all model deployments |
/health/fallback-events | Recent retry and failover events |
Use /health/readiness for your Kubernetes readiness probe. Use /health/liveliness for the liveness probe.
For proactive monitoring, enable background health checks:
general_settings:
  background_health_checks: true
health_check_interval: 300 # seconds/health/fallback-events endpoint is especially useful — it shows you when failovers happened and why. If you see frequent fallback events, it usually means a provider is having reliability issues.Prometheus Metrics
DeltaLLM exposes a rich set of metrics at /metrics in standard Prometheus format. Here are the most important ones:
Request metrics
| Metric | Type | What it tells you |
|---|---|---|
deltallm_requests_total | Counter | Total proxied requests |
deltallm_request_failures_total | Counter | Failed requests by error type |
deltallm_request_total_latency_seconds | Histogram | End-to-end latency (gateway overhead + provider time) |
deltallm_llm_api_latency_seconds | Histogram | Provider-only latency (isolates gateway overhead) |
Token and cost metrics
| Metric | Type | What it tells you |
|---|---|---|
deltallm_input_tokens_total | Counter | Total input tokens processed |
deltallm_output_tokens_total | Counter | Total output tokens generated |
deltallm_spend_total | Counter | Total recorded spend in dollars |
Cache metrics
| Metric | Type | What it tells you |
|---|---|---|
deltallm_cache_hit_total | Counter | Number of cache hits |
deltallm_cache_miss_total | Counter | Number of cache misses |
Deployment health
| Metric | Type | What it tells you |
|---|---|---|
deltallm_deployment_state | Gauge | Is this deployment healthy, degraded, or down? |
deltallm_deployment_active_requests | Gauge | How many requests are in-flight to this deployment right now? |
deltallm_deployment_cooldown | Gauge | Is this deployment in cooldown after errors? |
Setting Up Prometheus Scraping
# prometheus.yml
scrape_configs:
  - job_name: deltallm
    scrape_interval: 15s
    static_configs:
      - targets: ["localhost:4002"]
    metrics_path: /metrics
Or if you're on Kubernetes with the ServiceMonitor CRD:
# In your Helm values
prometheus:
  serviceMonitor:
    enabled: true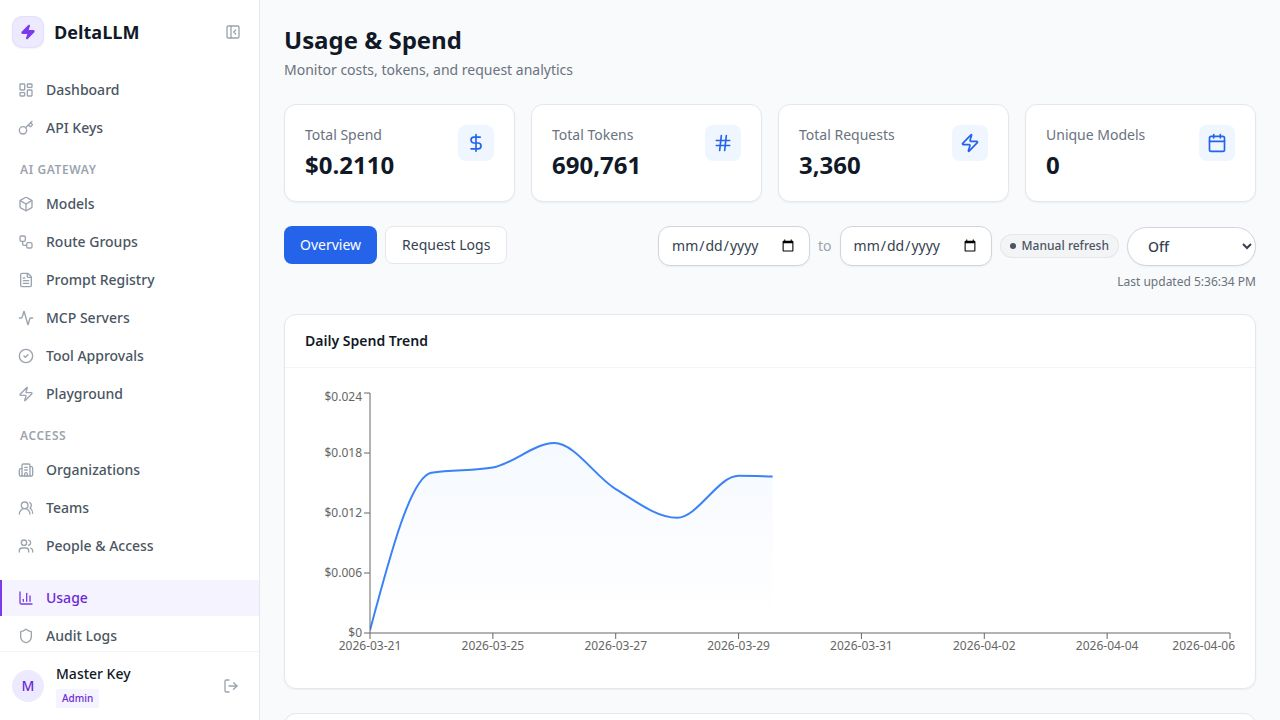
Key Dashboards to Build
Once metrics are flowing into Prometheus (or Grafana), build these dashboards:
- Request overview — total requests, error rate, p50/p95/p99 latency. This is your primary health signal.
- Provider comparison — latency and error rate per deployment. Quickly spot which provider is underperforming.
- Cost tracker — spend rate over time, broken down by model. Alert when daily spend exceeds your threshold.
- Cache effectiveness — hit rate over time. If it's dropping, your traffic patterns may have changed.
- Deployment health — state and active requests per deployment. Alert when a deployment goes into cooldown.
Callback Integrations
Beyond Prometheus, DeltaLLM can push data to external observability tools:
| Integration | Use case |
|---|---|
| Langfuse | LLM-specific tracing with prompt/response inspection |
| OpenTelemetry | Distributed tracing across your full stack |
| S3 | Long-term request log archival |
# config.yaml — enable Langfuse callbacks
deltallm_settings:
  success_callback:
    - langfuse
  callback_settings:
    langfuse:
      public_key: os.environ/LANGFUSE_PUBLIC_KEY
      secret_key: os.environ/LANGFUSE_SECRET_KEY
      host: https://cloud.langfuse.com
Message Logging Privacy
By default, request and response content is included in log payloads. If you don't want message content stored (for privacy or compliance), disable it:
deltallm_settings:
  turn_off_message_logging: true
Spend, token counts, and metadata tracking continue normally — you just stop storing the actual prompts and responses.
deltallm_audit_queue_depth, deltallm_audit_write_failures_total, and deltallm_audit_ingestion_latency_seconds. Monitor these to ensure your audit pipeline is healthy.